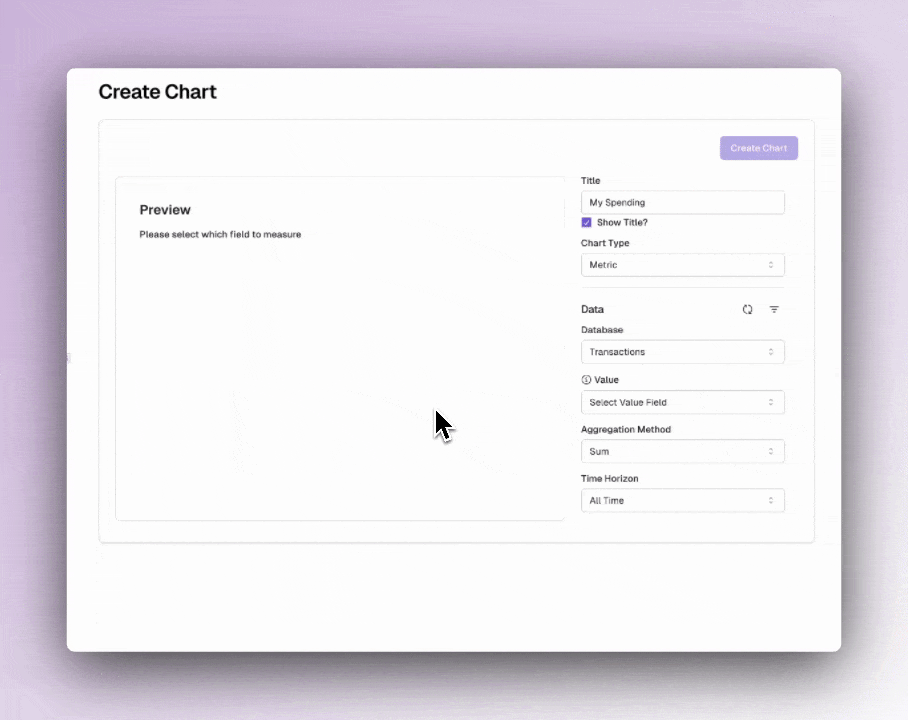
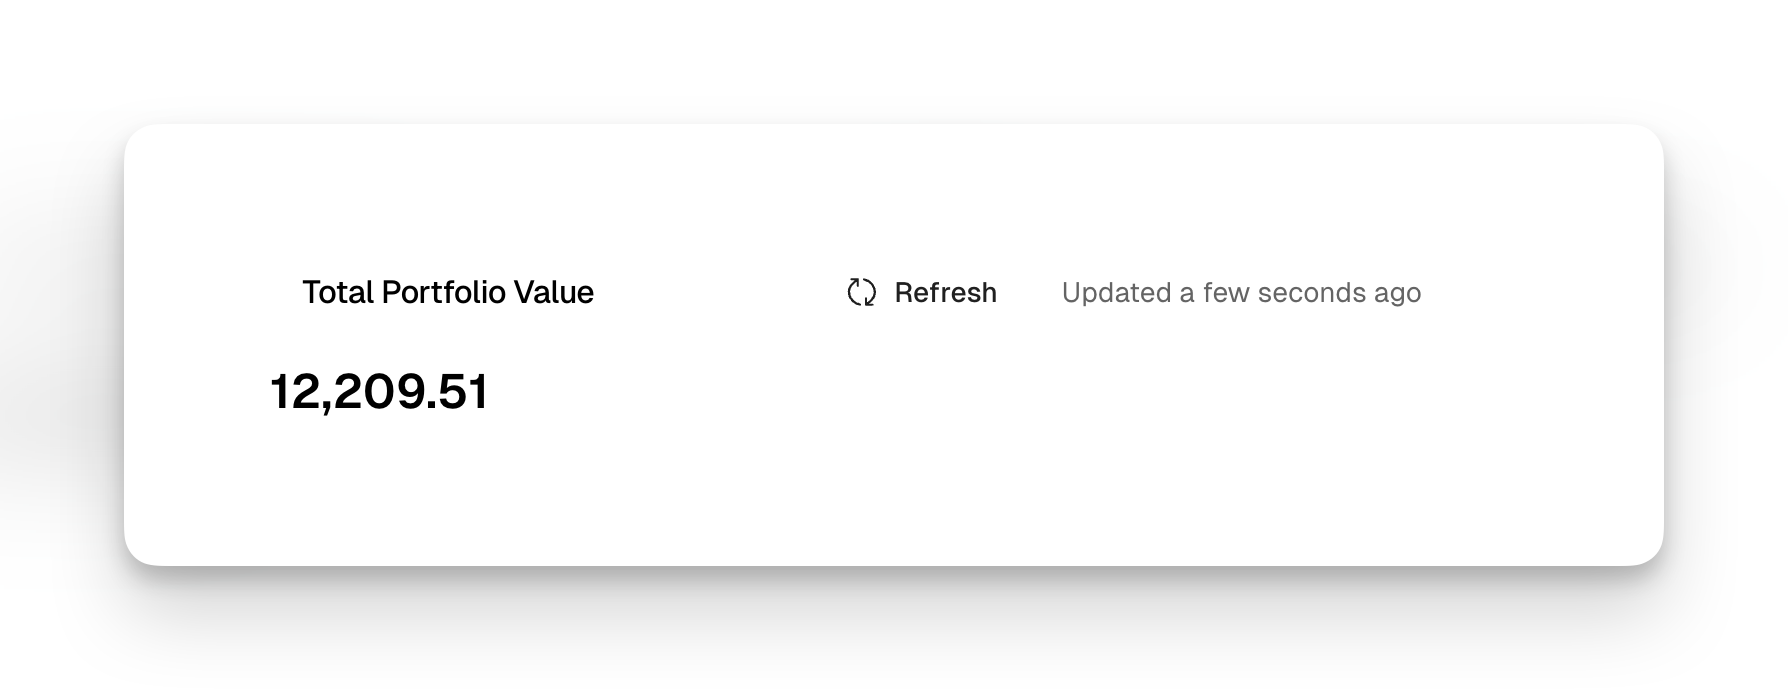
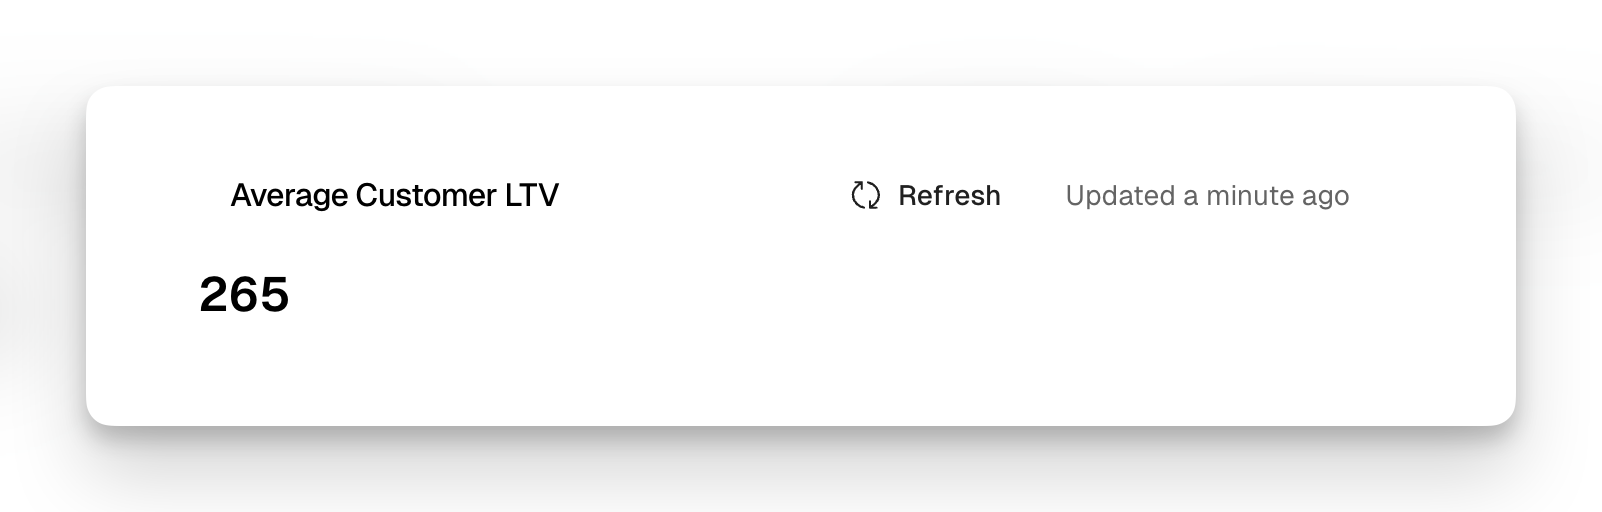
Skip to main contentA metric chart can be used show an aggregate value for a table.
Metric Calculations
Metrics can be the sum, average, maximum, or mininum of values within a specified column.
Time-Based Metrics
When creating a metric, you can select a time horizon to view the metric for. Available time horizons are day, week, month, quarter and year. After selecting a time horizon, select which field has the date column you want to use.
You can also compare the metric for this current period to the previous period. For example, you might want to compare total spending from this week to the previous week. To do so, check “compare to previous period”.
You can also toggle whether an increase in a metric is considered positive or negative. For example, an increase in spending might be negative while an increase in savings contributions would be considered positive.